

Most glass plants know how many panes they produced in a given month, but they do not know, on an ongoing basis, how much they earned on them. Orders sit in one place, production in another, and the result only appears when someone sums up the month in a spreadsheet. That is what glass plant analytics looks like in practice today in a plant that does not have a single system.
The new Analytics module in MonitGlass changes this approach. It collects the data the system already records during quoting, production and shipping, and presents it in clear reports. This lets the owner and the production manager see what is happening in the plant before the month is over.
Table of contents
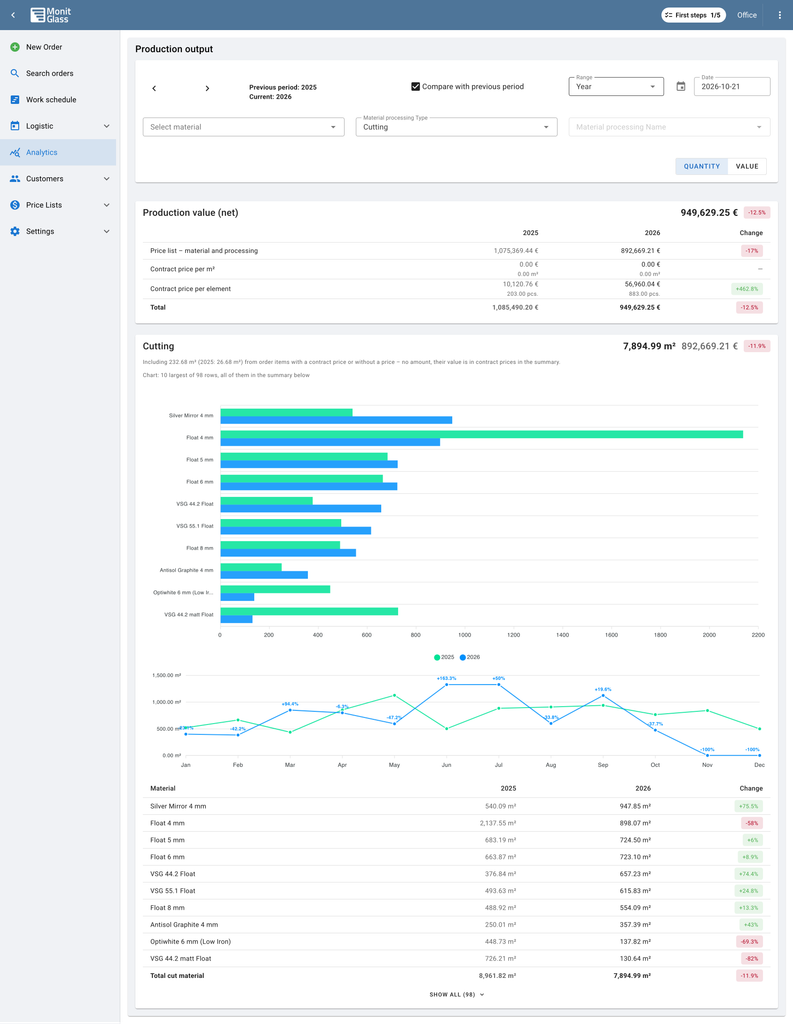
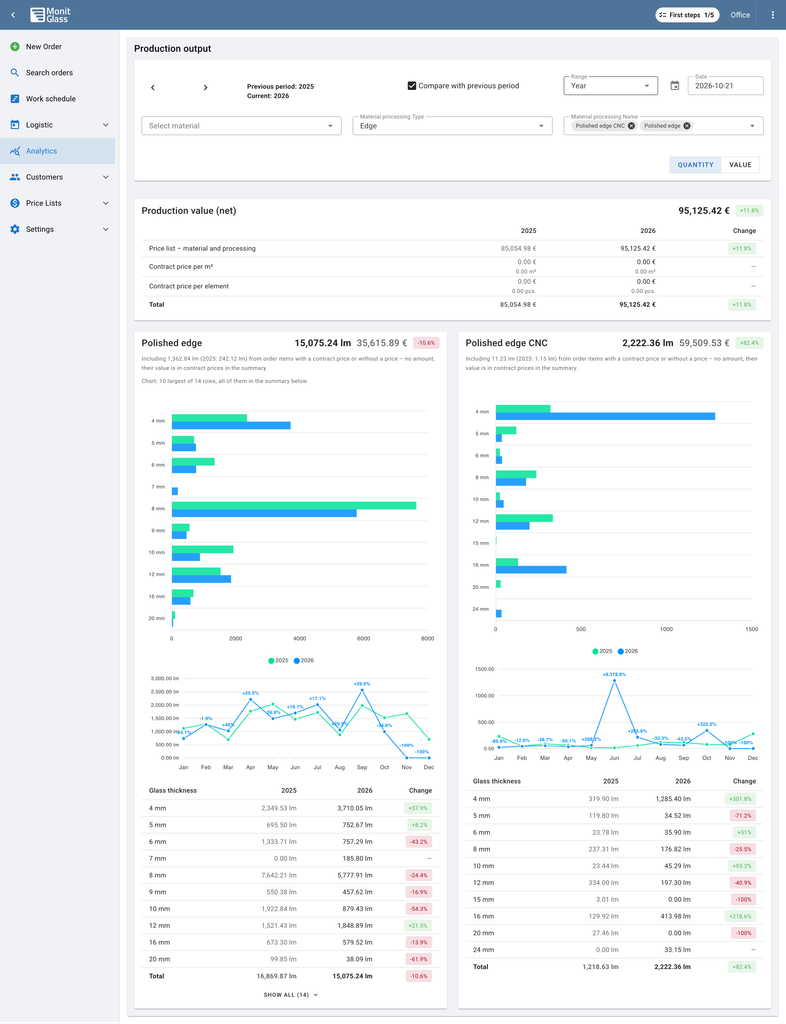
Glass plant analytics: what the module shows
The module answers the question of how much the plant earns and where time and material are being lost. In practice, it gives three kinds of insight:
- Plant revenue by day, week and month, so you can compare the current period with the previous one.
- Production and performance reports that show how order fulfilment is progressing on the shop floor.
- Material usage and deliveries, i.e. how much glass and accessories go into orders and what is happening with shipments.
Reports can be exported to Excel if you want to refine them or hand them over to accounting.
Which decisions it makes easier
Analytics is useful at every position, because everyone asks different questions.
The owner checks whether the plant is on plan. How much revenue did we make this week compared with last week? Will this month close better than the previous one? The answer is available immediately, without waiting for a report from the office.
The production manager sees where order fulfilment is slowing down and how much material goes into orders. This is the first step towards reducing waste and meeting deadlines.
The office and accounting work with the same data as the shop floor, so they do not have to re-enter or reconcile it. A settlement summary per order is available in the system.
How much you can gain: market data
Manufacturing companies that implement data analytics and MES systems typically report productivity gains of 10 to 25%, but results vary widely. The figures below come from general studies and case studies.
| Source | What was measured | Result |
|---|---|---|
| Consulting firm analysis, cited in an industry report | Productivity through data analytics and IoT | Increase of 10 to 25% |
| Research by an analyst firm, cited by an MES vendor | Overall manufacturing efficiency in companies with an MES system | On average 20 to 30% |
| Manufacturer from Wisconsin (USA), case study | OEE of five production cells after implementing analytics | Increase of over 20%, now above 70% |
| Manufacturing industry website | Productivity through machine and process data | Typically 3 to 5%, up to 25% in good implementations |
The real effect depends on the starting point. A plant that today calculates its results once a month in a spreadsheet has more to recover than one that already measures performance on an ongoing basis. That is why it is worth recording the baseline before implementation, for example order lead time and material usage per order, and comparing it with the new results after a few months.
Examples from glass plants
A glass manufacturer from Massachusetts (USA) is a 25-person glass processing plant that managed production in a simple accounting program and spreadsheets. It had no visibility of the shop floor, no reliable material planning and no confident quotes. After implementing an ERP system, automatic time recording on the shop floor and purchase planning, the company reports a 40% increase in revenue and stable profitability. The implementation was accompanied by lean workshops, so not all of the result is down to the software alone. Quotes calculated from a price list, tracking of shop-floor stages with QR codes and material control are now standard elements of systems built specifically for glass.
One window and door manufacturer recorded a 15% higher glass yield after implementing an ERP system connected to cutting optimisation. Efficiency also improved at every workstation. The key was bringing orders, cutting and production together in one place. Modern cloud systems for the glass industry make this possible without building your own IT infrastructure and with configuration instead of programming.
A company from Washington State (USA) shortened its lead times by two weeks thanks to production planning software. The plant increased capacity by 4% without hiring new people and still met its shipping dates. The basis was planning that takes into account the real capacity of workstations and the skills of the crew. A schedule that shows the load on days and workstations, and on which orders can be moved, is one of the features that ERP and MES systems for glass offer today.
In all three cases the starting point was the same: no up-to-date data from the shop floor. Glass plant analytics only starts to work when data on orders, material and production time ends up in a single system. If your plant still calculates its results in spreadsheets, it is worth checking whether a system built specifically for glass could deliver similar benefits sooner than you expect.
Why analytics works better in a single system
Glass plant analytics is only as good as the data it is built on. In MonitGlass the data comes from the same orders the office has already entered and from production stages confirmed by scanning a QR code on the shop floor. Nobody has to type results into a spreadsheet separately, so the report does not drift away from reality.
This is a big difference compared with Excel, where each department keeps its own table. When everyone works on the same data, the numbers in the report match what you see in the orders and on the shop floor.
The data comes from every stage MonitGlass handles day to day: enquiries, quotes and orders, planning of cutting, edge processing, tempering and IGU assembly, cutting optimisation, as well as tracking of transport and glass racks. Shop-floor workers confirm each stage in the mobile app, so production can run paperless. As a result, glass plant analytics covers the whole process, from the customer’s enquiry to delivery, not just one department. The system supports metric and imperial units, so the same reports work just as well in plants serving customers in North America.
The Analytics module runs in the same cloud as the rest of the system. We handle updates, backups and security on our side, and your team does not have to install anything.
How to get started
The Analytics module is best seen on your own data. A free MonitGlass demo account can be set up within an hour, and during a 30-minute presentation we will show you how your order moves from quote to report.
- Module details: monitglass.com/analytics
- Videos about the system: monitglass.com/videos and the MonitGlass YouTube channel
- Book a presentation: monitglass.com/contact
We encourage you to test the Analytics module and find out how much your plant really earns.

Comments are closed